
Data plays a vital role in almost every organization you see around you. Data is referred to the input from the companies to learn about the performance and mistakes if their performance is below average level. The activities that a consumer makes completely changes the existence of data from every point of view. Data is a mixed world of volume, variety, and variability.
Only with arranging the numbers in a tabular form can make it difficult for the analyst to explain the useful insights and at the same time also result in missing out the vital data about the consumers. This can eventually lead to the wrong formulation of Strategies and inappropriate decision making. This is where data visualization comes in and plays a vital role in the field of Analytics.
Table of Contents
What Do You Understand By Data Visualization?
The term itself explains that it is the visual representation of information or data and showing it in a schematic form consisting of variables and attributes. It is the work done to express data in a visual form to help people and users to understand the importance of data. Data visualization makes it easy to look at the patterns and correlations.
The organizations take the help of High technology software and web design company India to get the visualization of data in the best possible way. It also helps the marketers to understand different types of behaviours from the available information. There are different types of visualization tools that are not restricted to the basic charts and spreadsheet, but they involve some sophisticated and improved Technologies and techniques such as info-graphics, briefly explained bar and Pie Charts, heat maps, sparklines, etc.
The images might consist of interactive capabilities that allow the users to manipulate or drill them into the available information for analysis and future queries. The indicators can also be included that are designed in such a way that can alert the users when the data has been predefined or updated.

Importance Of Data Visualization In Today’s Date:
The way human brain processes data and information, it is easy to visualize charts or graphs for large amounts of complex information instead of pouring them on spreadsheets or reports. Data visualization is a fast process to convey the strategies and concept in a widespread manner, and you can also experiment with several scenarios by making little adjustments. With the help of data visualization techniques, one can identify the areas that need more improvement and supervision.
Consider choosing the best web design company India to incorporate data visualization and infographics in your organization for best results. One can clear the factors that influence customer behaviour. These techniques can help in understanding the products and where to position them. You can also predict the volume of sales with the help of data visualization techniques.
How It Is Helpful In Today’s Market?
With limited it resources and small budgets, some mid-range companies have no idea where, to begin with when it comes to getting the most benefits from there overly sized data. Data visualization is certainly going to change the work process for data analysts in today’s world. They are supposed to be working more on taking out information and insights from the data.
They are supposed to be working and responding to the issues in a much better way than before. If you have the best web design company India, it can help you with the most productive data visualization techniques for your company. Data visualization can help the data analysts to look at the data from a different perspective and in a more imaginative manner.
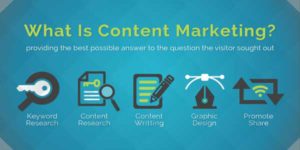
Another most effective way of expressing information visually is with the help of info-graphics. You can take the help of a web design company India to understand and make use of data visualization in your company. Info-graphic data visualization is nothing but the graphical presentation of information that takes the help of elements such as colour, design, and graphics to show the available content.
This technique is generally used to express difficult messages to the viewers in such a way that it improves the comprehension all together and makes the content look attractive and readable. Images are used in a written article in the form of an extension of the content, but when it comes to info-graphics, they come with a self-contained message are important information.
It helps in communicating a message, display the data in such a way that it looks compact and easily organized. Info-graphics help in analyzing data in a much productive way so that it can be understood easily by the readers.
 About the Author:
Hermit Chawla is a Marketing Manager at Sprak Design. He would love to share thoughts on Top Website Design Services, Lifestyle Design, Branding Firm, Exhibition design etc..


Be the first to write a comment.